Hi - anyone who knows how to work with Insights data…
We where getting data values that seemed to be all over the place so we did a new run on one of our courses Jan2020–des2020. But we are still getting data that none of us, including quantitive data specialist (post docs/Professors) and none of us understand that data coming out of OeX Insights. Numbers that should be the same in two or more places are different and averages do not sum up in any way that we understand.
Attachments included:
- Discrepancies in total enrolments: Instructor panel shows: 4191, and Insights shows: 3680 ??
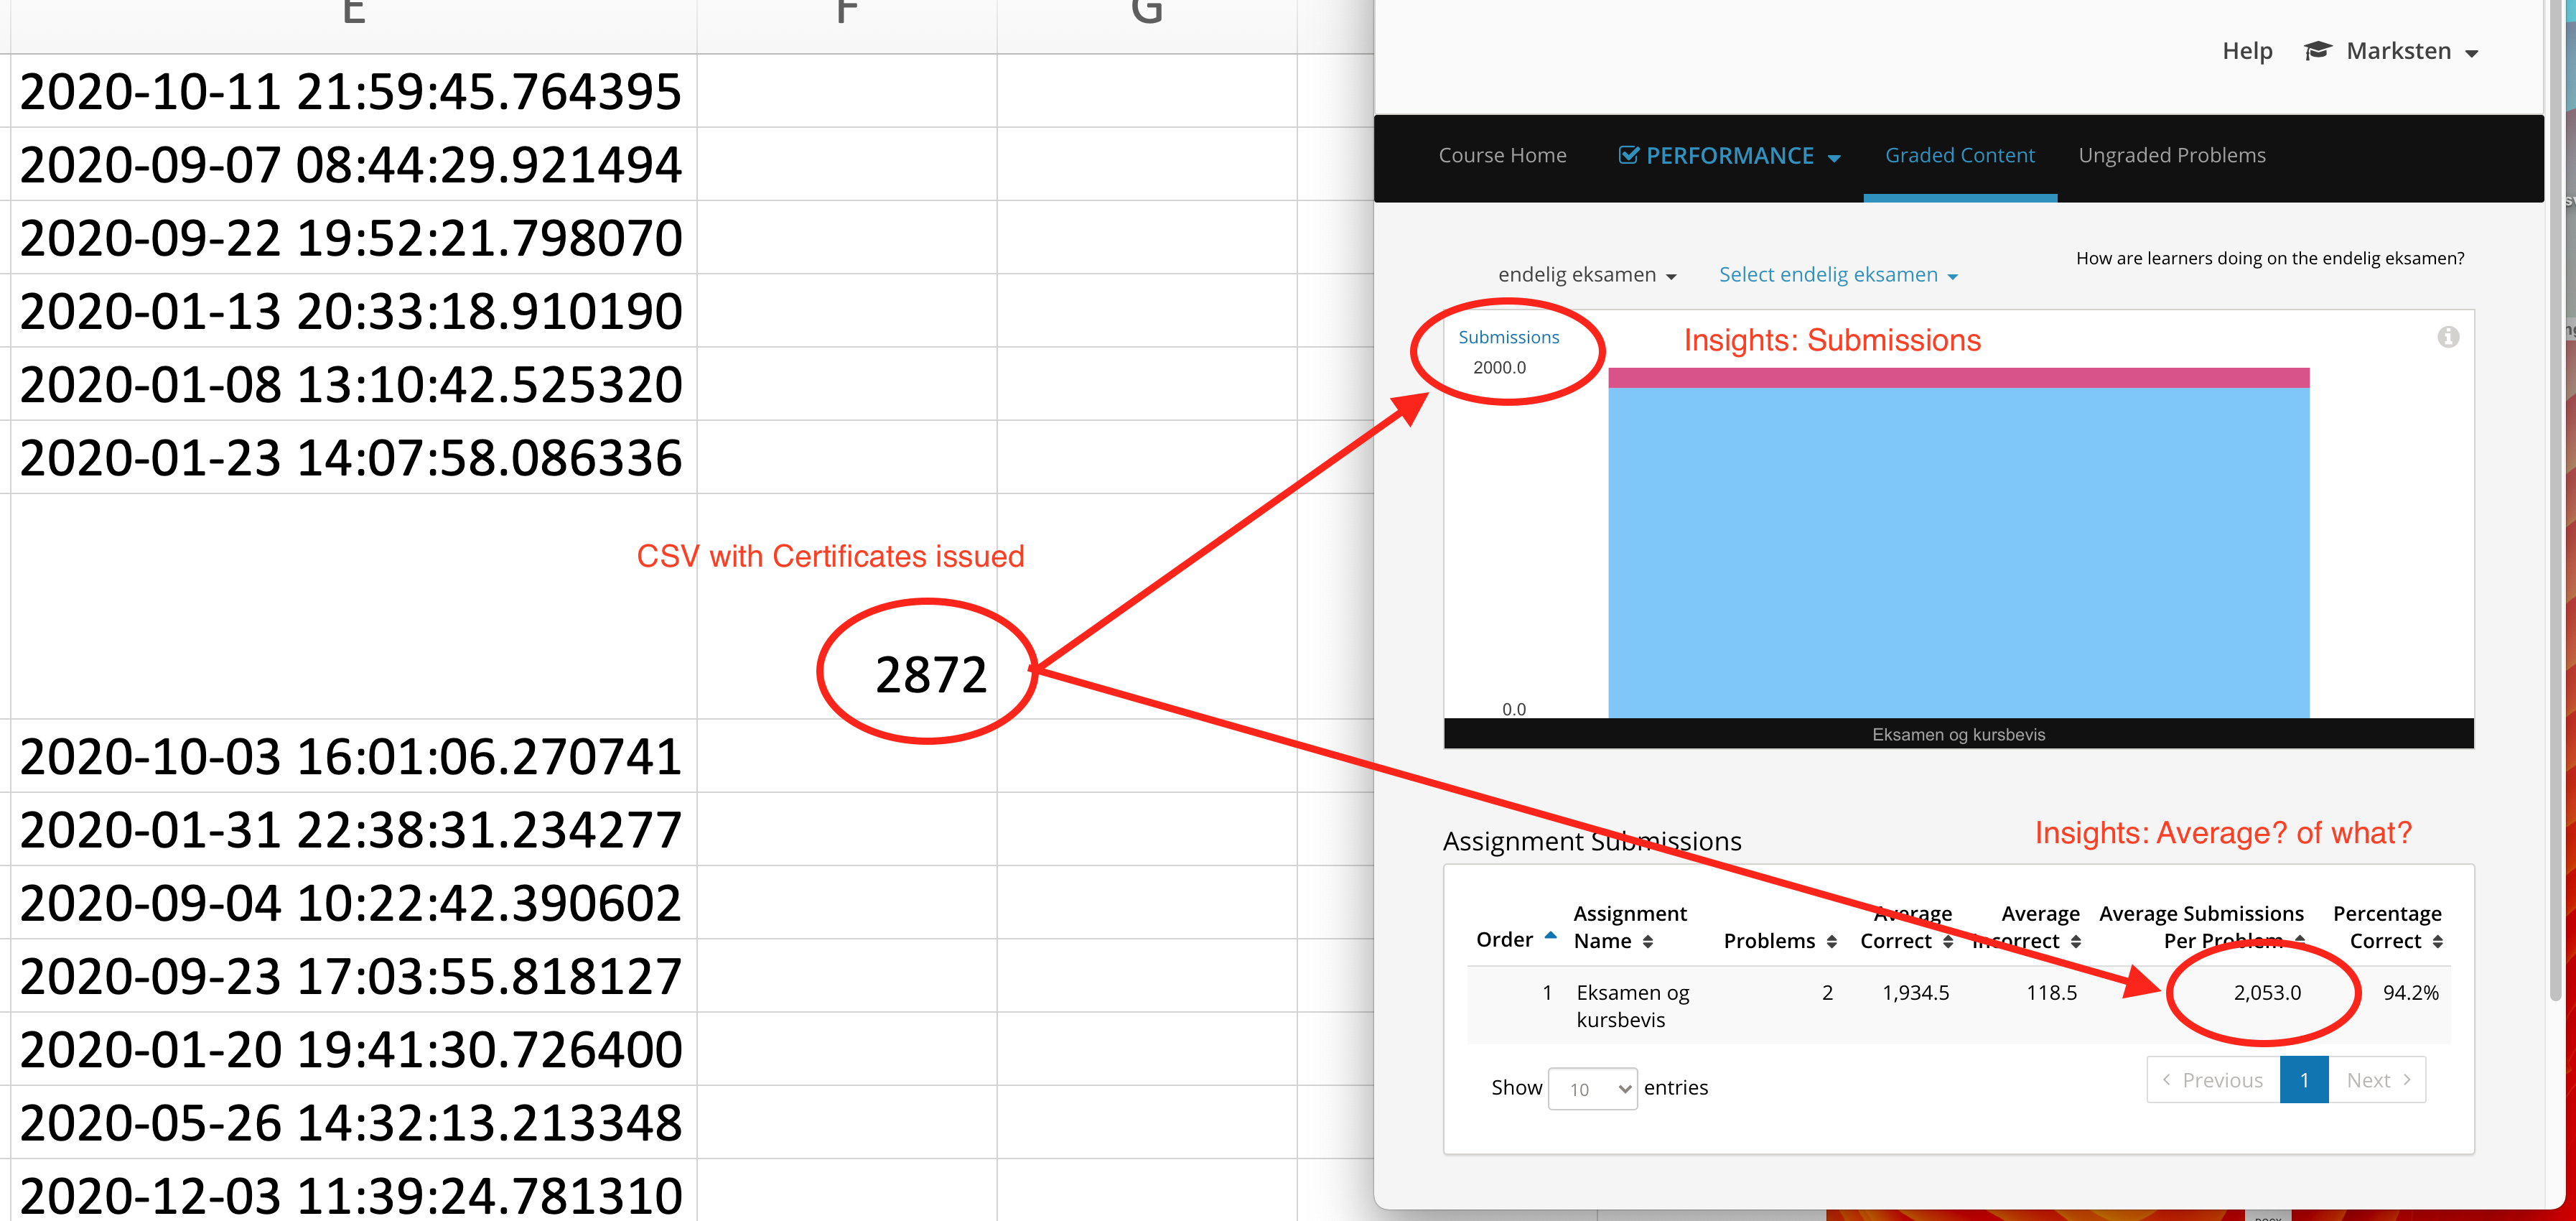
- Exam certificates discrepancies between downloaded CSV(2872) and Insights submissions (2000) and average submissions (2053)
I am sorry, but insights does not give us any numbers that seems to be logical or that can be trusted or explained. We need some help to understand this. Reading the Docs about Insight - gives no insight, unfortunately.
Uh… Not able to upload screenshots 
Anyone? Help?